Gold shadow price
Dec 24 · 10 min
TL;DR — The concept of the shadow price offers a theoretical framework for understanding how gold might be valued if certain historical monetary conditions were restored. It is not a price forecast, but rather a conceptual tool to understand the gap between today’s situation and a scenario in which gold reassumes a more central role as a monetary anchor.
* Gradement calculates real-time values for the shadow price and spot/shadow ratio factors (discussed below). These can be accessed here: gold factors as monetary assets.
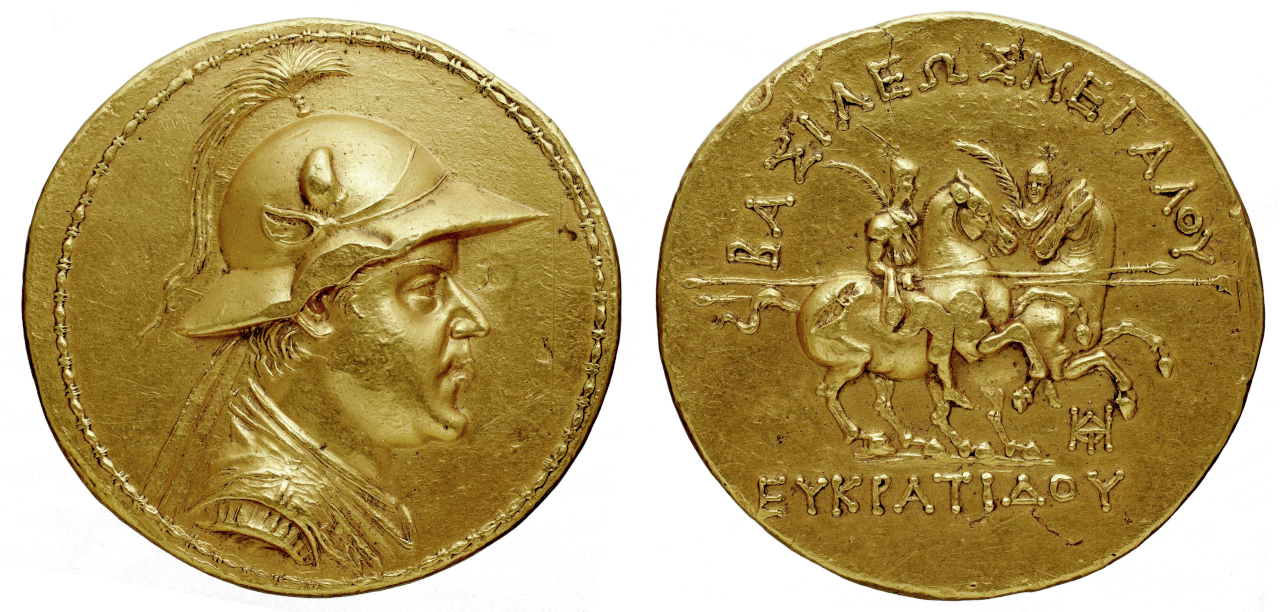 Gold coin of Eucratides I (171–145 BC), one of the Hellenistic rulers of ancient Ai-Khanoum. This is the largest known gold coin minted in antiquity.
Gold, Investment or Money?
In the market economy, gold occupies a unique position. Unlike stocks, bonds, or other financial assets, gold is not an investment; it is a monetary asset. This implies that the classic valuation methods, based on discounting future cash flows, as we would do with stocks or bonds, do not apply here. Gold does not produce yields or dividends; it does not generate cash flows over time. For this reason, many prominent investors, such as Warren Buffett and Charlie Munger, have questioned its role as an “investment.”
In the case of Buffett, he considers that there are three categories of assets, among which he places gold:
- Currency-related investments: Treasury bonds, corporate bonds, etc.
- Assets that produce nothing and are only purchased with the hope that someone will pay more for them in the future, including gold.
- Assets whose value lies in their ability to generate returns, such as stocks that produce profits/dividends.
However, classifying gold as an inert asset or merely a speculative bet is a mistake. It is a mistake because it is based on the erroneous premise that gold is an investment. Gold is not an investment; it is a monetary asset. It is money, and as such, it has historically fulfilled the essential functions that any asset serving as money must have:
- Facilitating the exchange of goods and services.
- Acting as the market unit of account.
- Acting as a store of value, enabling the storage and transfer of wealth both across space and time.
To establish a reference framework for gold pricing, we cannot rely on traditional valuation models based on cash flows or dividends. Instead, we will use another framework based on the relationship between the central bank's gold reserves and the monetary base issued by that bank. In this post, we will analyze the relationship between the Fed's gold reserves and the value of M0, the monetary base in dollars issued by the Federal Reserve.
Gold as Currency Throughout History
Gold has been considered money in various civilizations since about 600 BC, when the Lydian people minted the first coins called electrum. For centuries, the gold standard served as a reference point for the value of most national currencies, until 1971 when President Nixon officially severed the U.S. dollar’s tie to gold. This was a turning point: the world began to operate without a formal connection to the precious metal, ushering in an era of fully fiat currencies.
The complete decoupling from gold culminated at the end of the 20th century when Switzerland—considered the last major currency still partially backed by gold—also eliminated its official link to the metal. Even so, economic history shows that for over 2,600 years gold functioned as money. Today, we live in what can be understood as an unprecedented monetary experiment," without any formal linkage to gold.
Despite the official separation, central banks have not ceased to regard gold as money. They continue to accumulate gold reserves, which they treat like another “foreign currency” within their balance sheets. Although these reserves no longer officially back the currency issued, they contribute to stability and credibility, serving as an anchor of value in times of inflationary crises or loss of confidence. Some examples of current major gold holders include these central banks:
| Country | Reserves (MT) |
|---|---|
| United States of America | 8,133.46 |
| Germany | 3,351.53 |
| Italy | 2,451.84 |
| France | 2,436.94 |
| China | 2,264.32 |
| Switzerland | 1,039.94 |
The proportion of these reserves relative to the total issued currency has decreased over time, especially after abandoning the gold standard after the collapse of the Bretton Woods system in 1971. Nevertheless, the metal remains an important part of central banks’ strategies, even though its proportional weight is no longer what it was in the 18th or 19th centuries.
Valuation Methodology: The Shadow Price of Gold
Since gold is money rather than an investment, we might ask what price gold should have to maintain a meaningful historical relationship with the issued currencies.
The shadow price of gold arises from considering the relationship of gold reserves held by central banks relative to the monetary base (M0). Historically, the relationship between gold and the issued currency had more stable references. Focusing on the U.S. dollar and revisiting the gold standard era, one finds that an average of 25% has occurred quite frequently. In other words, at key historical moments, the value of gold in reserves has averaged one-quarter of the total issued currency.
The idea behind the shadow price is that in a severe inflationary crisis, if the Federal Reserve wanted to reestablish a 25% historical gold backing of its currency, to add confidence and stability to its monetary system, the price of gold would have to adjust upward.
This adjustment could happen in several ways:
- Increased central bank demand for gold, to add to their reserves, pushing its price higher due to greater demand.
- Depreciation of the currency (inflation), raising gold’s price in dollar terms because the currency itself is worth less.
We can express the shadow price as:
Let’s consider the current case for the U.S. dollar:
We get:
This calculation yields a shadow price of around 5,322 USD per troy ounce of gold, far above the current spot price of roughly 2,600 USD (as of December 2024). This theoretical value indicates where the gold price would need to go if the Fed, or the market, decided to restore or approximate the historical ratio of a 25% gold backing relative to the currency in circulation.
The Spot/Shadow Ratio: Overvalued or Undervalued Gold?
The Spot/Shadow ratio shows the relationship between two gold prices: the current gold price (spot price) and the shadow price defined above. This ratio is calculated as:
With a spot price of around 2,600 USD and a shadow price of 5,322 USD, we have:
A ratio below 1 indicates that gold is undervalued relative to the 25% historical target. If the aim were to restore that proportion, the price would need to double. Historically, the spot/shadow ratio in the U.S. has averaged about 1 since 1959, suggesting that for long periods gold was more closely aligned with that 25% threshold.
The historical high of the ratio, 5.81, occurred on January 21, 1980, during the height and final period of the 1970s inflation crisis and just before Paul Volcker’s restrictive monetary policies began to bring inflation under control. This peak marked an extreme moment when the market perceived gold’s value as significantly higher relative to the monetary base.
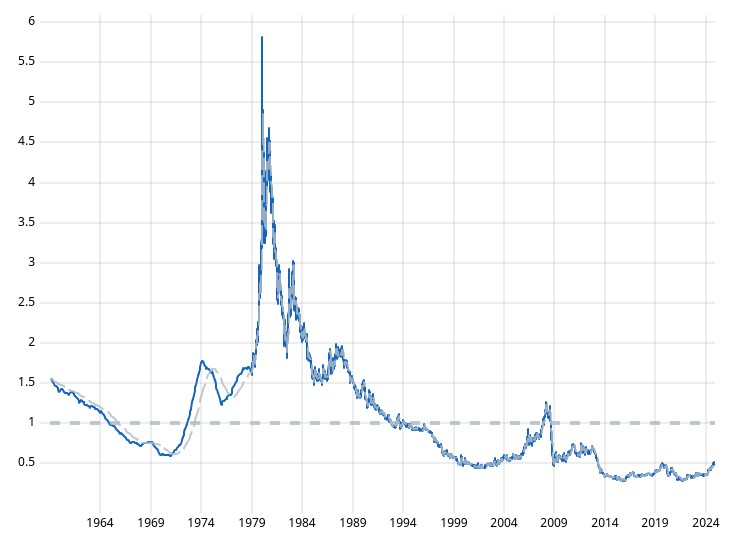 Spot/Shadow ratio value from 1964 to 2024.
* You can access the up-to-date version of this chart HERE.
Summary
The concept of the “shadow price” offers a theoretical framework for understanding how gold might be valued if certain historical monetary conditions were restored. It is not a price forecast, but rather a conceptual tool to understand the gap between today’s situation and a scenario in which gold reassumes a more central role as a monetary anchor.
This methodology does not assert that gold will reach its shadow price, but it does illustrate gold’s latent potential as a store of value in an environment of expanding monetary bases and inflationary uncertainty.
Sources
- World Gold Council: Historical gold reserves data by country.
- gold-api.com: Spot gold price.
- Federal Reserve Bank of St. Louis: Historical data for the U.S. monetary base (M0).
- International Monetary Fund: Information on the Federal Reserve’s gold reserves.