Why Alphabet is a great company but a poor investment
Oct 17 · 6 min
TL;DR — Alphabet's fundamentals are great. We can only raise an objection: its current price.

In this post we will analyze Alphabet exclusively from a quantitative point of view using Gradement. You know Alphabet: the company formerly called Google that recently decided to do a corporate restructuring separating its different lines of business between Google and its many other companies created or acquired.
You all know, or should know, that all investment decisions can be divided in a quantitave and a qualitative part. Both are equally important. The quantitative part deals with pure accounting data. It uses accounting analysis techniques to draw conclusions about solvency, profitability and company valuation. The qualitative part uses subjective judgment based on unquantifiable information such as management expertise, business prospects and economic cycles.
There are three accounting variables to analyze in every investment decision from a quantitative point of view: profitability, solvency and price. All of them are equally important.
Profitability 101
In this first post about Alphabet we will analyze its profitability. One way of measuring profitability is to compare the capital that partners and investors contribute to the start-up and subsequent operation of a company, with the capital that these partners and investors may obtain from it. The greater the capital extracted in relation with the capital contributed, the greater the profitability. There is a saying in accounting analysis about how no account balance has any meaning only by itself, it always has to be compared with some other balance or accounting variable.
For instance, if you were to be asked "Which company is better, company A, with a 100 million dollar income, or another company B that earns "only" 1 million?". The great majority, having no idea of accounting analysis, would certainly stay with the 100 million dollars company. On the other hand, the correct (and short) answer that an accounting expert would give you would be a "depends". And that is the correct answer. What would it depend on? It will depend on the level assets that the company needs to use to generate these profits.
Let's say company A, the one with the 100 million dollar earnings, has assets of 1 billion. And company B assets are 1 million dollars (the same level of assets as earnings). With this level of assets and earnings, the respective profitabilites are:
- company A profitability = 100/1000 = 10%
- company B profitability = 1/1 = 100%
Now it is clearly obvious that company B is better than A. With B we are earning annually the same amount that we have contributed, while the A company is generating a 10% of what we have contributed to the business. With company A, to earn those attractive 100 million, we must previosly make a 1 billion dollar down payment.
Alphabet's profitability
Let's now calculate Alphabet's profitability. No, you don't need to take out your pencil and calculator, Gradement automatically performs all these calculations for us. If you look for Alphabet Inc. and go to the non-monetary items you will find an item called Adjusted firm return on invested capital %.
This item is a much more sophisticated measure of profitability than the one we use earlier for companies A and B. From the total level assets contributed by partners and investors we substract the commercial liabilities and the surplus cash. Commercial liabilities are deducted from total assets because they are not contributed by investors or partners but by the company's suppliers. Also we substract "surplus cash", the cash that the company holds as buffer just in case, but does not use in its daily operations.
Without going into too many details, this is the function Gradement uses for its profitability calculation:
                            adjusted operating earnings
Adjusted ROIC = ------------------------------------------------- x 100.0
                total assets commercial liabilites surplus cash
and these are the results of applying that function to Alphabet's accounting information:
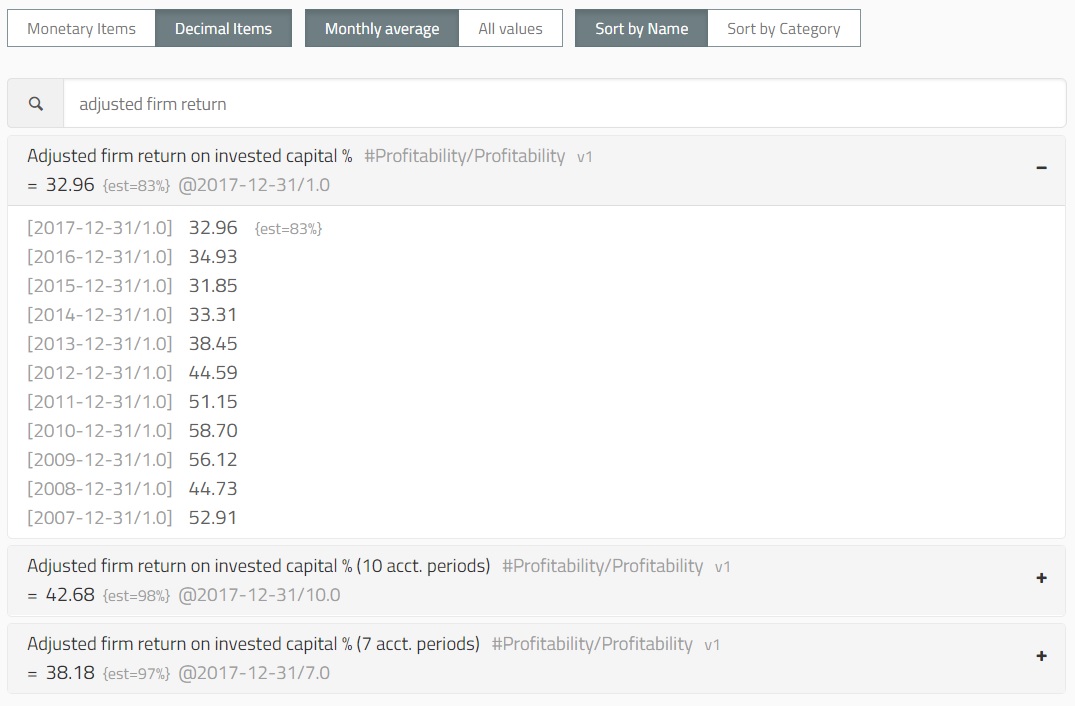
An impressive 32.96%. Alphabet is gaining today 32.96 dollars on every 100 dollars put into the business. And how impressive is this figure? A lot. To get an intuition we have calculated the average and median of this same item for all US companies of a certain size (Size score greater than or equal to 70).
- median = 8.06%
- average = 10.84%
A significant difference with the Alphabet's profitability figure.
By the way, the attentive reader will have certainly observed how in the previous table the figure of 32.96% it's associated with end date of this exercise (2017-12-31) and you will wonder how we can calculate the profitability at the end of this year without even knowing what the total earnings and assets of Alphabet will be at the end of this accounting exercise. It is true that this data is not yet available, but we already have the interim data of each quarter for this exercise (except for the last one). With that quarterly info we can estimate this profitability figure at the end of accounting period.
The alert reader may have also observed an {est = 83%} beside this figure. This 83 over 100 is a measure of the confidence level that we gives to this 32.96% estimate. This figure will be closer to 100 (maximum certainty) as we approach the end of the accounting exercise and more interim data became available to make this estimate.
In addition to this return on adjusted capital investment, there are other ways to measure profitability. To compute its Firm profitability score Gradement additionally uses these three other accounting variables:
- The firm free cash return on invested capital
- The adjusted operating margin
- And the operating cash flow margin
In the decimal items section you can also get the value of these profitability variables for Alphabet:
- firm free cash return on invested capital = 87.98%
- adjusted operating margin = 23.18%
- operating cash flow margin = 83.84%
Using all these measures of profitability Gradement calculates for Alphabet a Grade of 100 out of 100. The maximum possible for a grade. Now, how good is that grade value compared to other American companies? We do not need to calculate it ourselves, Gradement offers us this information with its Zone relative profitability score.
For Alphabet, the calculated value for this
Alphabet is without a doubt a very profitable company. One of the most profitable in the US (for those readers who love statistics, in the 98th profitability decile). But not only profitability is important in the investment decision making process. Another important aspect is solvency, which will be analyzed in the second part of this post.
A small spoiler of the following post on Alphabet's solvency: as impressive as its profitability.