CAPE and Other Market Valuation Factors
Jun 22 · 9 min
TL;DR — The optimal approach to investing is to buy profitable, solvent, and undervalued companies in markets that are not overvalued. To value those markets, it is best to use a combination of the CAPE ratio and cash-flow-based factors, selecting those with the highest correlation.
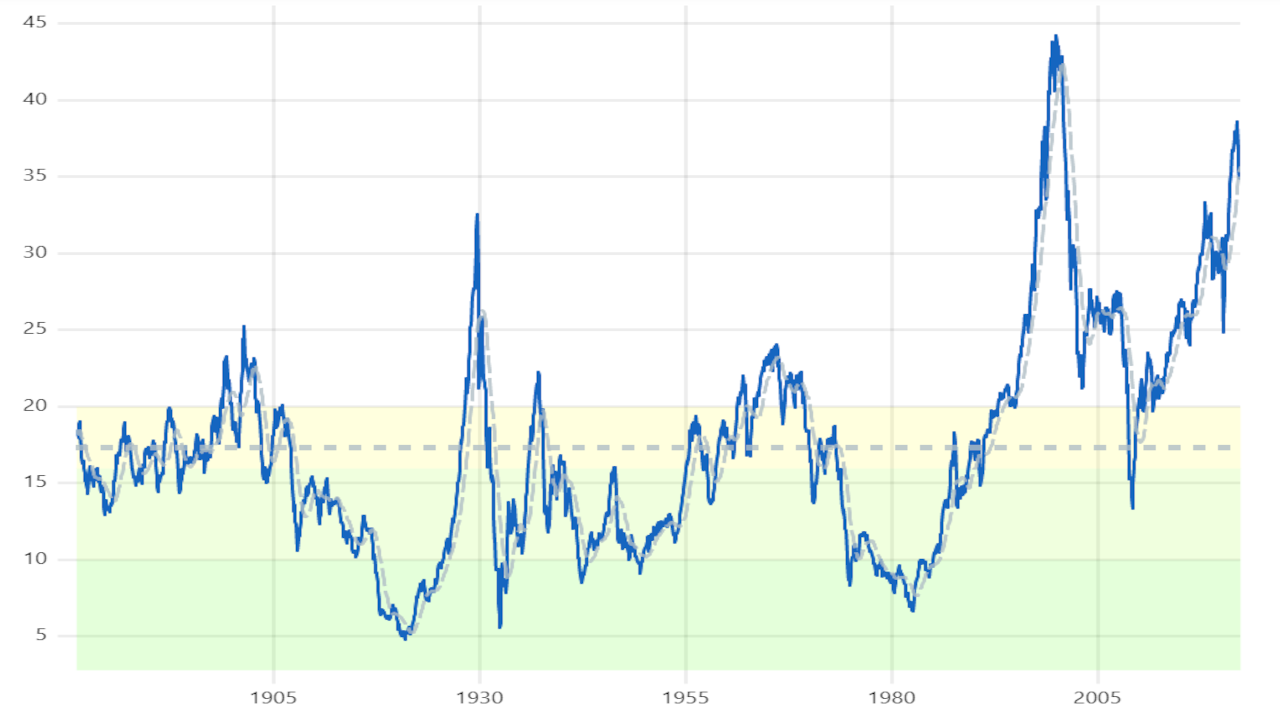 Value of the CAPE factor from 1881 to the present day.
The CAPE Ratio
The CAPE (Cyclically Adjusted Price-to-Earnings) ratio is one of the best indicators of whether a market is overvalued or undervalued.
Defined by Robert Shiller in his book Irrational Exuberance, its use became popular during the dot-com bubble. Its value is calculated like a standard P/E ratio, dividing market price by earnings, but instead of using the most recent year's earnings, it uses the arithmetic average of the last 10 years' earnings as the denominator. This smooths out distortions from occasional peaks and dips in earnings, making the ratio more indicative of the relationship between the price and the earning power of companies in the market.
As a general rule of thumb, ratio values between 10 and 20 are considered fair valuations, values below 10 suggest undervaluation, and values above 20 indicate overvaluation. In this post, Lyn Alden explains the usefulness, predictive ability, and limitations of this ratio. She summarizes the idea behind its definition as follows:
Here's the problem. During a recession, stocks fall, but corporate earnings fall sharply as well, which can temporarily raise the P/E ratio. Since we want to buy when the P/E is low, this gives us a false signal that the market is expensive, that we shouldn't buy, when indeed it's the best time to buy.
Shortcomings of the CAPE Ratio
Despite its usefulness, which has been demonstrated by several studies pointing to a strong inverse correlation between the ratio's value and average market returns over the following 15 years (see Lyn's article), the CAPE ratio has some shortcomings:
- The inverse correlation between the CAPE ratio and future returns is not as strong in small or less diversified markets (such as those in countries with specialized economies).
- Changes in accounting standards for defining earnings by the IASB or FASB can make CAPE values from different periods not strictly comparable.
To overcome the first shortcoming, the ratio should only be applied to large, heterogeneous markets.
The second deficiency is more complicated to overcome and stems from the use of book earnings, as published by companies in their financial statements. Current generally accepted accounting principles (GAAP), as defined by the IASB/FASB, are based on the accrual method. This method requires matching all revenues and expenses to the correct accounting period. The problem is that these standards allow some flexibility in how this matching is done.
For example, a company can alter a period's expenses by changing the depreciation schedules for its assets or adjusting provisions for potential asset impairments.
Alternative Factors
Unlike earnings, free cash flow does not allow for this kind of accounting flexibility (in this post, we analyze the relationship between the two). If we substitute free cash flow for earnings in the CAPE formula, we get a more reliable metric that is less vulnerable to arbitrary accounting rules.
This allows us to define the following alternatives to the CAPE ratio:
- P/FCFE: The size-weighted average market capitalization (P) divided by the size-weighted 10-year moving average of free cash flow to equity (FCFE) for all companies in the selected market.
- EV/FCFF: The size-weighted average enterprise value (EV) divided by the size-weighted 10-year moving average of free cash flow to the firm (FCFF) for all companies in the selected market.
In the long run, earnings and cash flows should converge to the same average or cumulative value (see https://blog-en.gradement.com/teleportation/). Therefore, in theory, there should be a high correlation between the CAPE ratio and cash-flow-based factors, since their calculations use cumulative average values over several accounting periods.
For the US market, there is a very high correlation between these valuation factors and the CAPE ratio. The Spearman correlation between all factors is greater than 0.8, and the Pearson correlation is greater than 0.9 (see https://gradement.com/markets/unitedstates?lang=en).
In smaller markets, this high correlation is not always present. In such markets, it is useful to have these cash-flow-based alternatives to the CAPE ratio and to analyze the correlation between them. This allows us to select the set of factors with the highest correlation and discard those that are least correlated with the majority. A high correlation among different factors suggests they are all correctly measuring the same underlying economic reality.
The Importance of Not Buying in Overvalued Markets
Even for a fundamental investor focused on the financial and economic analysis of a specific company, it is crucial to have an idea of whether the broader market is undervalued or overvalued.
The price of any stock always shows some degree of correlation with the market in which it is listed. This correlation is measured by the beta coefficient. A higher beta value indicates a higher correlation with the market.
This correlation means that even if an investor finds a profitable, solvent, and undervalued company, a major correction in an overvalued general market will still affect the company's share price.
Even if we buy in an overvalued market, an investment in a profitable, solvent, and undervalued company is likely to be profitable in the long term. Eventually, the market will recognize the company's quality through its price. However, if the investor had waited to buy until the market was undervalued or reasonably valued, the investment would likely be profitable sooner, and the long-term returns would be even higher. This is because the investor could have bought the company at a much lower price during a market correction.
Summary
As fundamental investors, it is not enough to analyze a company's financials. Before investing, we must also consider whether the market in which the company is listed is overvalued or undervalued.
The optimal approach is to buy profitable, solvent, and undervalued companies in markets that are not overvalued. To value the market, it is best to use a combination of the CAPE ratio and cash-flow-based factors, selecting those with the highest correlation among them.